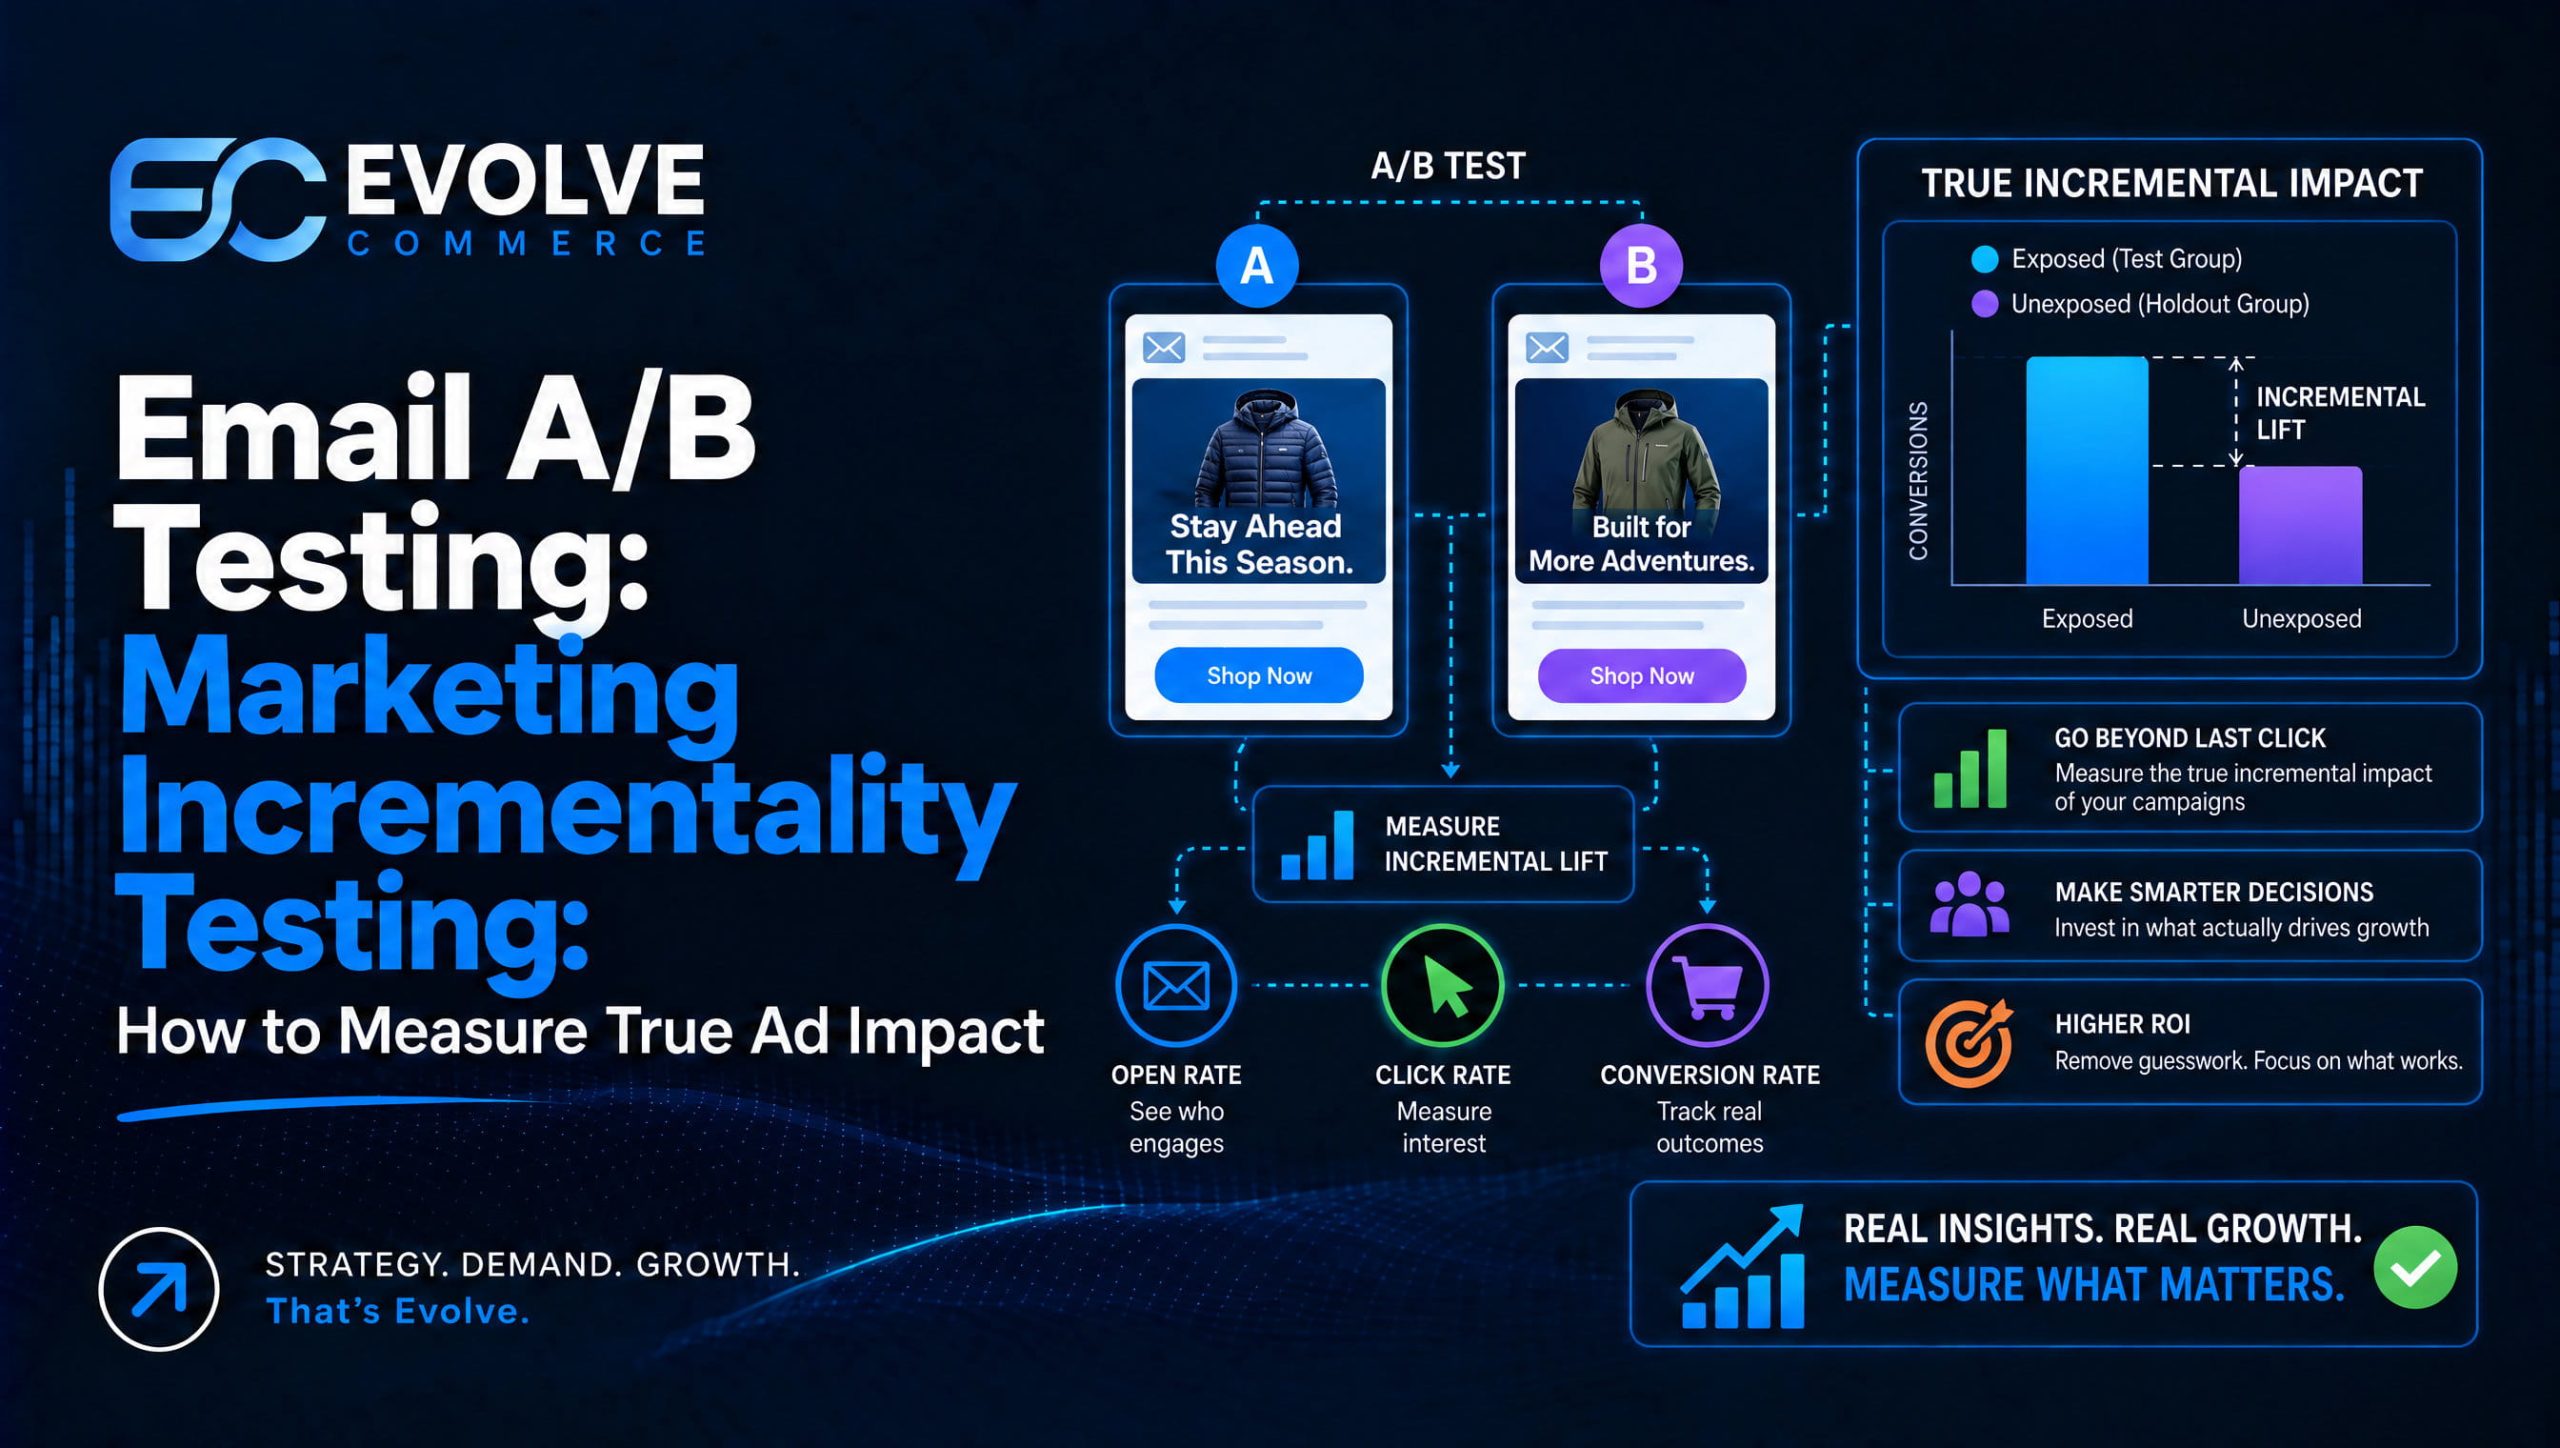
Marketing incrementality testing is a controlled experiment that shows how many sales or conversions your advertising actually caused, as opposed to sales that would have happened anyway. You compare a group exposed to your marketing with a comparable group that is not, and the difference is your incremental impact. For ecommerce brands spending across several channels, it is the clearest way to see which budgets create new revenue and which simply collect credit for it.
This guide covers what incrementality is, how conversion lift and geo holdout tests work, how to calculate lift and incremental return on ad spend, how incrementality differs from attribution, and how to run a first test without wasting budget.
- Incrementality testing measures the extra sales your marketing caused by comparing an exposed test group with an unexposed control group.
- Conversion lift tests work at user level inside a platform. Geo holdout tests compare matched regions and suit situations where individual tracking is impractical.
- Incremental conversions equal test conversions minus control conversions. Read the confidence interval, not only the headline lift.
- Attribution and incrementality answer different questions. Use experiments to calibrate attribution, and media mix modelling to tie both to budget planning.
- Plan the test before you spend: market selection, duration, clean media buying and a stated decision you will make from the result.
Table of Contents
- What marketing incrementality testing actually measures
- The main types of incrementality test
- Conversion lift tests, including Facebook conversion lift
- How a geo holdout test works
- How to calculate incrementality and lift
- Incrementality vs attribution
- Where media mix modelling fits
- Common mistakes that spoil a test
- What to test first
- Our perspective
- How Evolve Commerce can help
- FAQ
- Sources
What marketing incrementality testing actually measures
Marketing incrementality is the measure of additional sales, conversions or business outcomes that marketing directly caused and that would not have happened without it, as Ipsos MMA defines it. The test behind it is a randomised controlled experiment: one group sees the campaign, the other does not, and the gap between their outcomes is attributed to the advertising. The IAB UK measurement toolkit describes these tests as a way to quantify the true contribution of a channel, campaign or tactic to growth.
Why does that matter in practice? Because a platform dashboard reports conversions that followed an ad, not conversions that needed one. Consider three kinds of shopper:
- Shoppers who were always going to buy, such as loyal customers searching for your brand name.
- Shoppers who bought because the ad reached them.
- Shoppers who would not buy whatever you did.
Only the second group is incremental. A campaign can look excellent in reported ROAS while mostly harvesting the first group. Incrementality testing separates the groups so you can fund the activity that genuinely adds customers.
The main types of incrementality test
There are two approaches ecommerce teams meet most often. Which one fits depends on the channel, the conversion source and how granular you need to be.
| Method | How it splits the audience | Best suited to | Main watch-out |
|---|---|---|---|
| Conversion lift (user-based) | Individual users are randomised into test and control inside the ad platform | Single-platform questions, such as whether a Meta or Google campaign drives extra purchases | Limited to what the platform can randomise and measure |
| Geo holdout | Matched regions are split into test and control, with ad spend adjusted in the control regions | Cross-channel or online and offline questions, or when user-level tracking is unavailable | Regions differ in demand, promotions and seasonality, so matching matters |
Google states that its Conversion Lift tests can be run with Google or agency teams and can be based on users or on geography, depending on the conversion source and the level of granularity you want.
Conversion lift tests, including Facebook conversion lift
A conversion lift test compares conversions between people who were eligible to see your ads and a control group who were held back. Meta’s Conversion Lift follows this pattern: it compares conversions between a test group that has seen an ad and a control group that has not. The IAB UK’s Building a Suite of Truth paper also describes calibration tests that compare Conversion Lift results against attribution reporting.
That calibration idea is the practical value. The same paper reports a Meta-led meta-analysis in which rules-based attribution models undervalued Meta’s contribution by a median of 31%. Your own result will differ, which is exactly why running your own test beats relying on an industry average.
When you set one up on a social platform, agree these points before launch:
- The decision. What will you change if lift is high, and what if it is low?
- The conversion event. Purchases are cleaner than add-to-baskets for judging revenue impact.
- The campaign scope. Test one campaign, objective or channel group, not everything at once.
- The duration. Long enough to capture your normal purchase cycle, including a full week-to-week rhythm.
- The freeze. Avoid changing budgets, creative or promotions mid-test unless the change applies equally to both groups.
If you are building out your social programme at the same time, our guide to planning a social advertising strategy covers how to structure campaigns so they are easy to test.
How a geo holdout test works
A geo holdout test splits matched geographic regions into treatment and control groups and adjusts ad spend accordingly, then compares results, as the IAB UK toolkit explains. In a UK context that might mean pausing a channel in some regions, say selected ITV or TV regions or groups of postcode areas, while it keeps running elsewhere. The IAB UK toolkit positions geo tests as appropriate when individual-level tracking is unavailable or impractical, including cross-channel and omnichannel measurement.
Geo testing suits ecommerce brands in several situations:
- Consent and privacy limits mean you cannot reliably track individuals across channels.
- You want to test a channel that platforms cannot randomise at user level, such as out-of-home or audio.
- You sell both online and through stores or wholesale, and want the combined effect.
- You want a platform-neutral read rather than one provided by the platform selling the ads.
The design challenge is matching. Regions can differ in baseline demand, promotions, competitor activity, weather and seasonality, so choose test and control regions that behaved alike before the test and keep promotions identical across both. Ipsos MMA notes that reliability depends on market selection, test duration, media buy integrity and control of confounding factors. A rushed geo split is the most common reason a result cannot be trusted.
How to calculate incrementality and lift
The arithmetic is simple. Google’s help documentation sets it out in its guide to understanding Conversion Lift results:
- Incremental conversions = conversions in the treatment group minus conversions in the control group (adjusted for group size when the groups differ).
- Relative lift = incremental conversions divided by control conversions.
- Incremental ROAS (iROAS) = incremental revenue divided by media spend.
A worked example
Imagine a UK homeware brand tests a prospecting campaign using two equal-sized groups. These numbers are illustrative, not client results.
| Measure | Test group | Control group |
|---|---|---|
| Orders | 1,200 | 1,000 |
| Revenue | £72,000 | £60,000 |
Incremental orders are 1,200 minus 1,000, so 200. Relative lift is 200 divided by 1,000, which is 20%. Incremental revenue is £12,000. If the campaign cost £8,000, iROAS is 12,000 divided by 8,000, so 1.5. Whatever the platform reports as ROAS for the same campaign, 1.5 is the figure that reflects revenue the campaign added. Whether 1.5 is good depends on your margin: compare it with the break-even return for your gross margin before deciding to scale.
Read the confidence interval, not just the lift
Google advises interpreting results with the confidence interval as well as the headline number. A reported 20% lift with a wide interval might be anywhere from barely positive to very strong. Plan budgets for the range, and be cautious about scaling on a single result that sits at the optimistic end. If the interval spans zero, the honest conclusion is that the test did not detect a lift, which can mean the effect is small or the test was underpowered. Longer duration, a bigger audience or a cleaner design are the usual remedies.
Incrementality vs attribution
Attribution tracks individual touchpoints and assigns credit for conversions, usually for short-term, granular optimisation. Incrementality testing uses controlled experiments to establish causal impact. The IPA’s article on making measurement triangulation work describes attribution as granular, tactical and reactive, and experiments as the method that establishes causal links.
They are not rivals. Use attribution for day-to-day decisions such as creative rotation, bid changes and audience tweaks. Use incrementality to check whether the credit attribution hands out is deserved. The IPA also cautions that attribution should not set strategic budgets by itself because it lacks a holistic, causal view of every business driver.
A practical way to combine them:
- Run an incrementality test on a major channel.
- Compare the incremental result with what attribution reported for the same period.
- Calculate the gap and apply it as a calibration factor to that channel’s attribution going forward.
- Repeat when the channel mix, creative or market conditions change materially.
For brands working without individual-level tracking, our piece on cross-channel attribution without individual tracking goes deeper on the alternatives.
Where media mix modelling fits
The IPA promotes triangulation: attribution gives granular tactical feedback, experiments establish causal impact, and media mix modelling (MMM) integrates them while capturing wider drivers such as pricing, seasonality and other external factors. Each method calibrates the others. The IAB UK toolkit makes the same point for UK measurement, recommending experiments to validate tactical attribution data and MMM to connect those signals to longer-term goals.
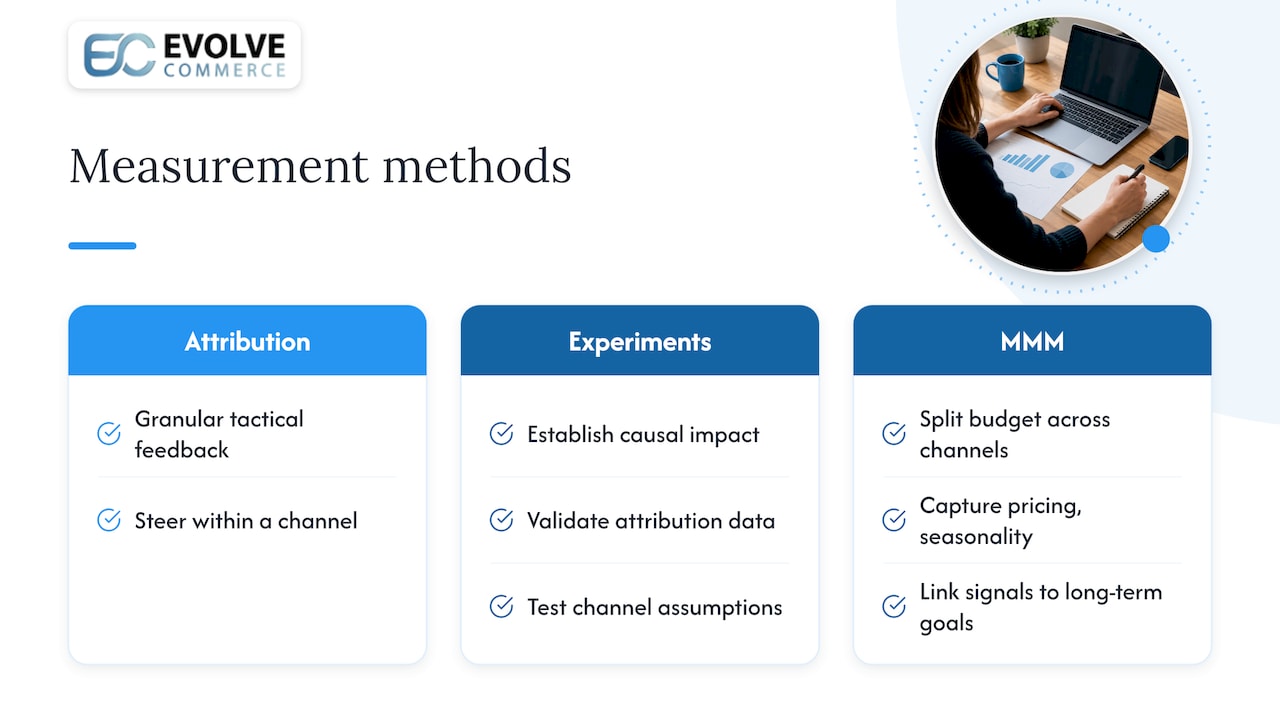
In plain terms, MMM tells you how to split a total budget across channels, experiments tell you whether your model’s assumptions about a channel hold, and attribution helps you steer within a channel. If you are considering the modelling side, read our guide to marketing mix modelling without cookies.
Common mistakes that spoil a test
- Before-and-after comparisons. Comparing a campaign period with the weeks before it mixes the campaign’s effect with seasonality, promotions and everything else that changed. A holdout group exists to avoid exactly this.
- Poorly matched regions. Geo tests only work when test and control behaved alike beforehand.
- Changing things mid-test. New offers, price changes or big creative swaps in one group contaminate the result.
- Stopping early. A few days of data rarely gives an interval narrow enough to act on.
- Testing without a decision attached. If no result would change your budget, the test is a cost, not an insight.
- Treating one result as permanent. Lift shifts as creative fatigues, competitors move and your audience saturates.
Smaller stores can borrow the same discipline for on-site experiments too, for example chatbot A/B testing with low traffic, where sample size is the constraint.
What to test first
Start where the stakes and the doubt are both highest:
- Branded search and shopping. Often the most over-credited activity, because many of those shoppers were already on their way.
- Retargeting. It reaches people who have already shown intent, so the incremental share can be much smaller than reported.
- Prospecting on social or video. Often under-credited by last-click views, so a test can reveal hidden value.
- Retail media. Where sales happen on a retailer’s platform, see our guide to measuring retail media attribution properly.
Then link the findings to your unit economics. Incremental results mean more when set against customer acquisition cost and lifetime value, and our LTV to CAC guide shows which numbers to pull. A clear marketing dashboard helps you keep the tested numbers visible next to platform-reported ones.
Our perspective
Most ecommerce teams we meet are not short of data. They are short of agreement on which number to believe. Platform ROAS says one thing, the analytics tool says another, and finance sees a third.
We build growth as a connected system, so we treat incrementality as the reference point that the other measures are checked against. Paid media, creative, email and SMS, and search all feed the same revenue outcome, and a test on one channel should inform how we weigh the rest.
That is why our work combines campaign management with proprietary analytics. Our AdWize platform is designed to bring tracking, server-side attribution and performance insight into one place, so that the results of a lift or geo test sit beside daily reporting rather than in a separate slide deck.
Our advice is to test the channels where you spend the most first, act on the confidence interval and keep re-testing as creative and markets change. Measurement should make budget decisions easier and more accountable, and that is the standard we hold ourselves to.
Evolve Commerce
How Evolve Commerce can help
Incrementality results are only useful if they feed straight into budget and creative decisions. We manage paid media across Google, Meta, TikTok, Microsoft, Snapchat, Reddit and other platforms, produce performance creative, and run lifecycle email and SMS, with analytics connecting the lot. If you want a consolidated view of performance, the AdWize analytics platform is available on three published plans: Starter at £49 per month, Accelerator at £149 per month and Scale at £249 per month.

If you would rather have a team design the tests and act on the answers, see our full-funnel growth services and ask about a 360° Marketing Audit.
FAQ
What is the difference between incrementality testing and attribution?
Attribution assigns credit to the touchpoints a customer interacted with, which is useful for tactical optimisation. Incrementality testing uses a control group to show which conversions your marketing actually caused. The IPA recommends using them together, with experiments calibrating the credit attribution assigns.
How do you calculate incremental conversions?
Subtract control group conversions from test group conversions. Divide that figure by control conversions to get relative lift, and divide incremental revenue by media spend for iROAS. Check the confidence interval before you act on the headline figure.
When should I use a geo holdout test rather than a conversion lift test?
Choose a geo holdout when user-level tracking is unavailable or impractical, or when you want to measure across channels or between online and offline sales. Choose conversion lift when you want a platform-level answer for a single channel. Geo tests need carefully matched regions.
How long should an incrementality test run?
There is no universal number, because it depends on your purchase cycle, traffic and the size of the effect you hope to detect. Ipsos MMA lists test duration among the factors that determine reliability. Run long enough for a narrow confidence interval and agree the length before launch.
Sources
- What Is Marketing Incrementality? | Ipsos MMA
- Measuring Digital Advertising in a Multi-Media Context | IAB UK
- Building a Suite of Truth | IAB UK
- Understand your Conversion Lift based on users measurement | Google Ads Help
- Use incrementality testing for effective marketing | Google
- Making measurement triangulation work | IPA