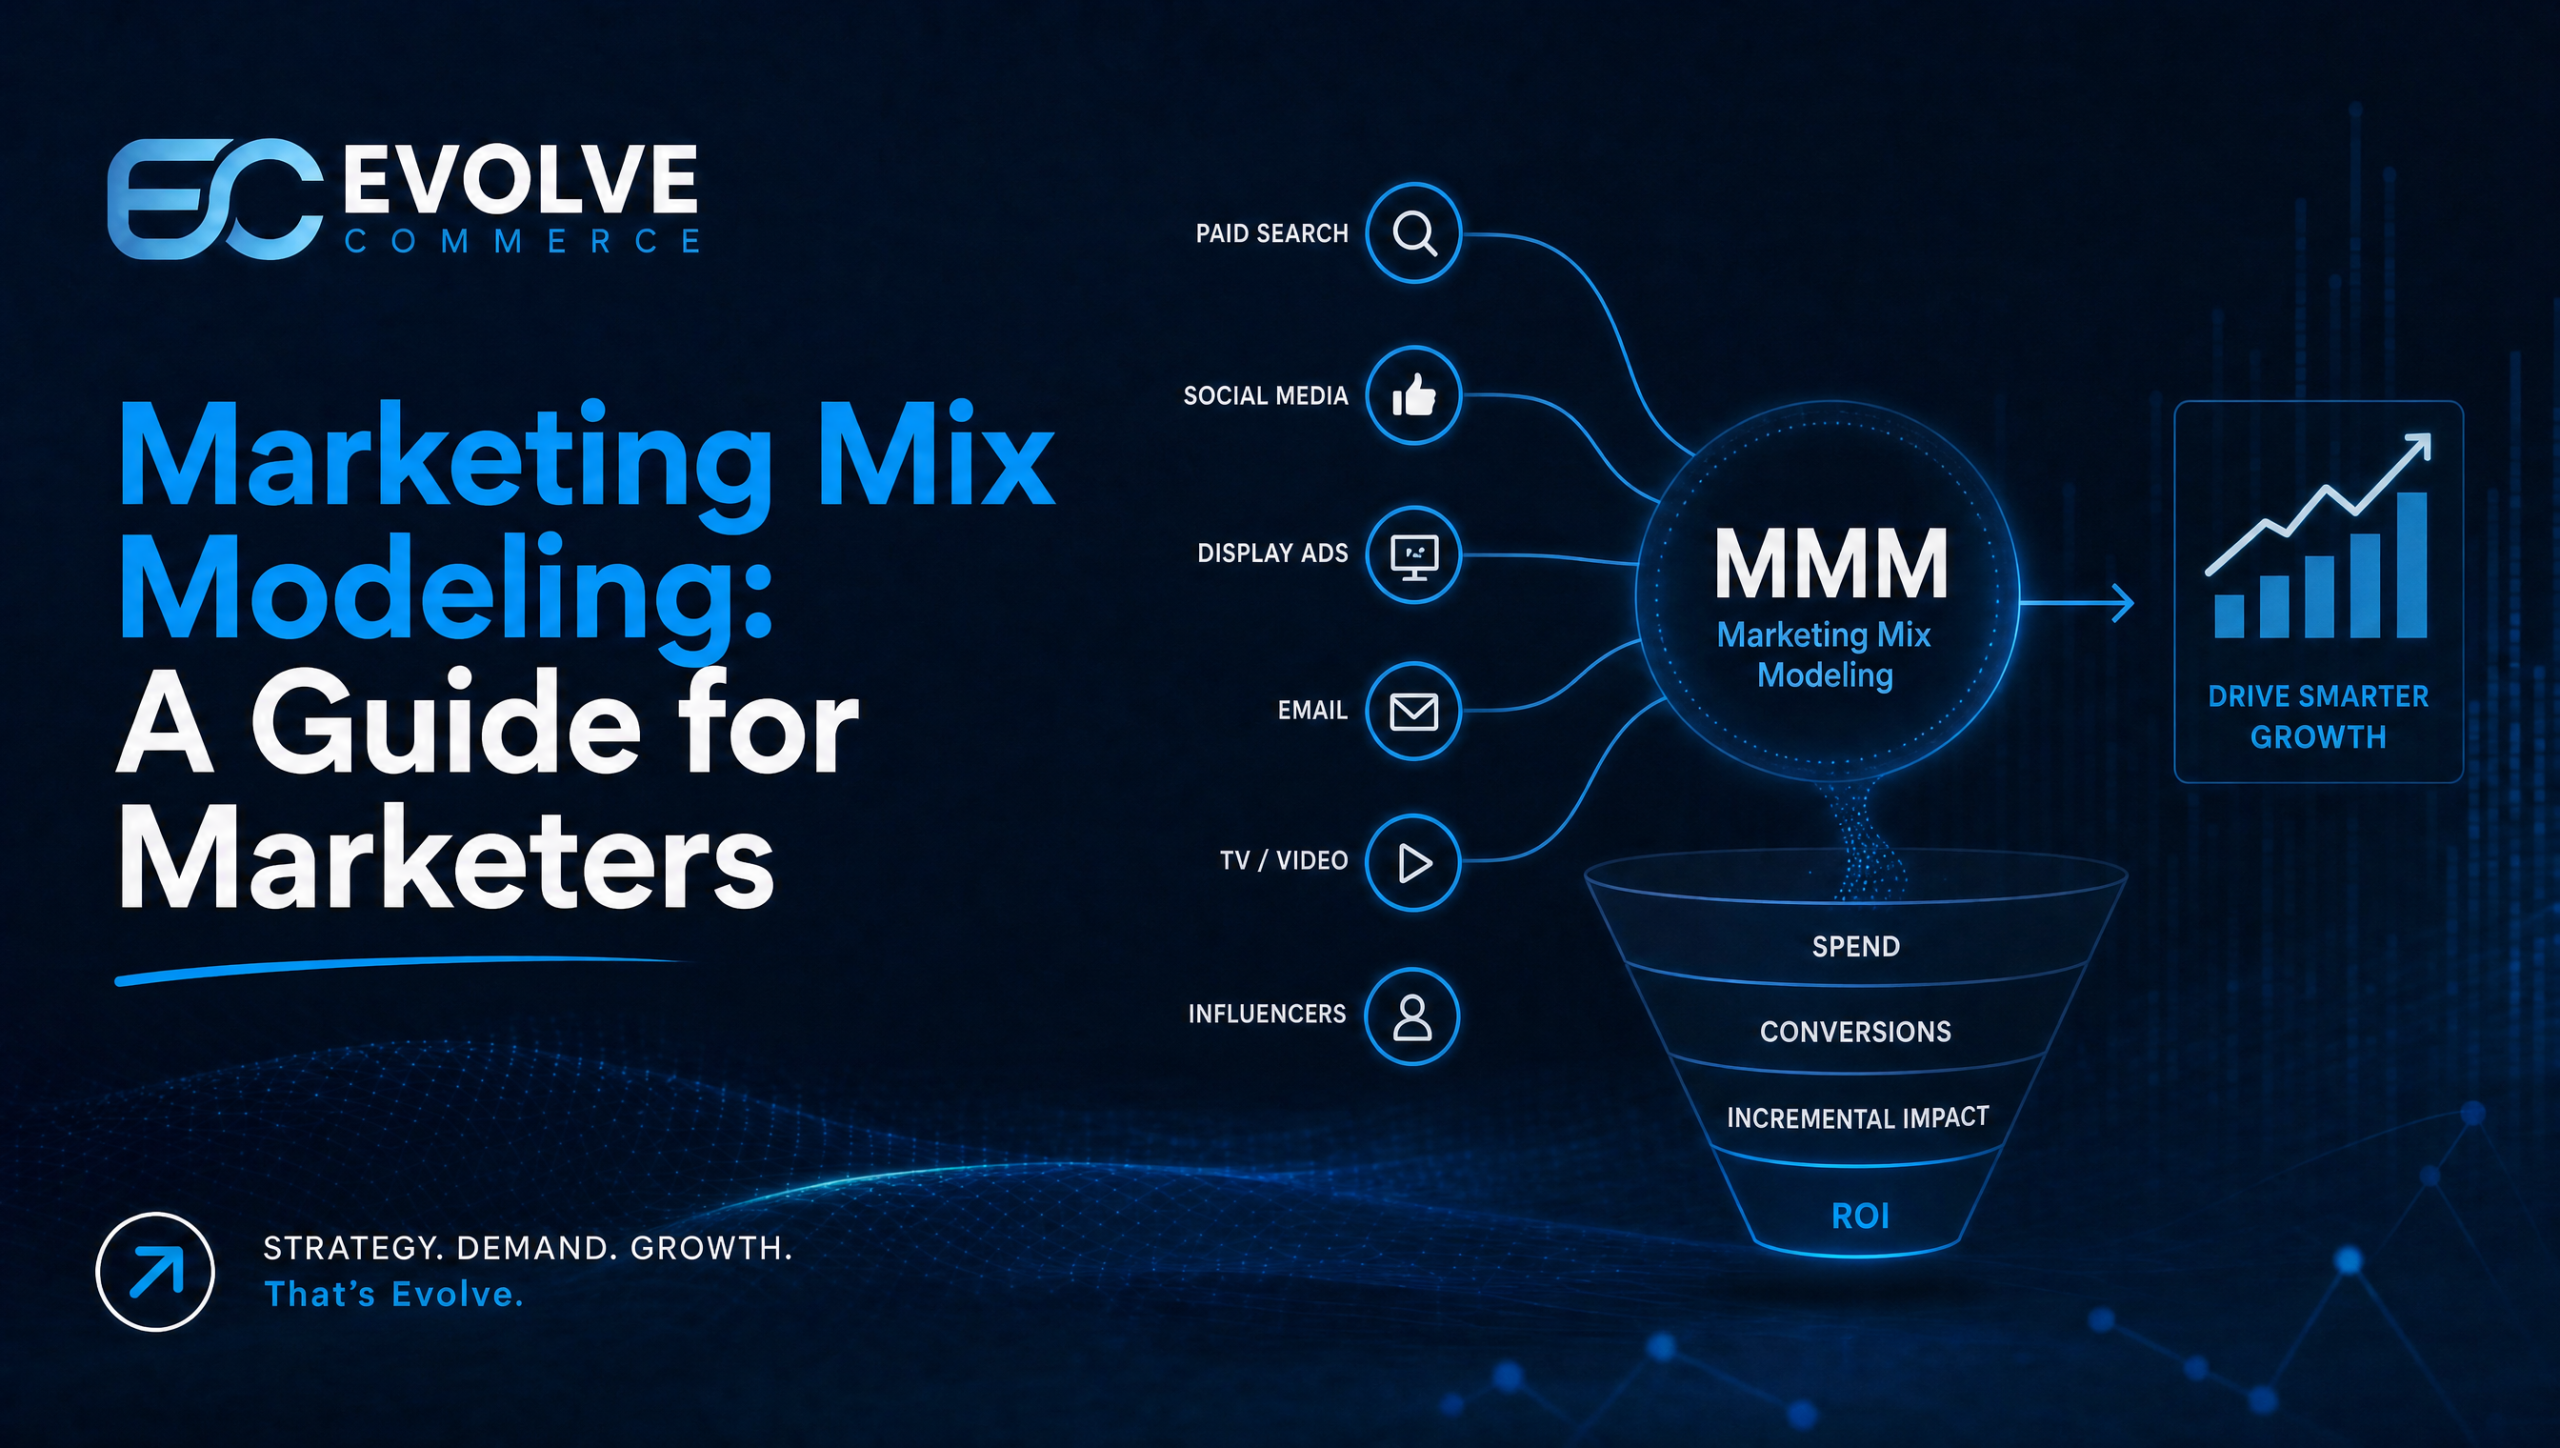
Marketing mix modelling (MMM) is a statistical method that quantifies how each marketing input, from TV to paid social to price promotions, contributed to sales over time. It lets you reallocate budget based on evidence rather than instinct. Modern, software-driven MMM makes this faster and more accessible than the consultant-led projects of the past, and the sections below walk through how it works, what it needs, and how to put it to use.
- Marketing mix modeling captures a broader set of factors, including pricing, promotions, and external influences, making it more comprehensive than attribution.
- Adstock, saturation, and base versus incremental sales decomposition are key concepts enabling MMM to estimate true channel contributions over time.
- Bayesian MMM provides uncertainty ranges for estimates, which can be more reliable for decision-making than single point figures from frequentist models.
- High data quality and validation against known events are essential; missing or inconsistent data can lead to confidently wrong results.
- MMM is most effective when integrated into a measurement stack alongside attribution and experiments, supporting strategic budget reallocation and scenario planning.
Table of Contents
- What is marketing mix modelling and how does it differ from attribution?
- How does MMM work? Adstock, saturation and decomposition explained
- Bayesian or frequentist? Choosing your modelling approach
- What outputs and KPIs actually matter?
- What data do you need before starting an MMM project?
- How do you use MMM for budget scenario planning?
- How does MMM fit with attribution and experiments?
- What does an MMM project actually look like, phase by phase?
- Where does Evolve Commerce fit into this measurement picture?
- Where marketing mix modelling fits in your measurement roadmap
- Ready to put marketing mix modelling to work?
- Sources
What is marketing mix modelling and how does it differ from attribution?
Marketing mix modelling is a statistical causal inference technique. It uses regression analysis on historical time series data, usually several years of weekly sales and marketing figures, to estimate how much each input actually moved the needle on revenue or profit, according to the definition used on Wikipedia’s marketing mix modeling entry. That scope is wider than most people assume.
A well-built MMM does not just measure media spend. It captures pricing changes, promotional calendars, distribution shifts, and external drivers like seasonality, competitor activity, and even weather, then decomposes total sales into what would have happened anyway (base sales) versus what your marketing actually generated (incremental sales), as Ipsos MMA’s overview of marketing mix modelling explains.
That scope is what separates it from two terms people often use interchangeably:
- Media mix modelling is narrower. It typically restricts itself to media channels and spend, leaving out pricing, promotions, and macro variables. MMM is the broader discipline; media mix modelling is one slice of it.
- Multi-touch attribution works at the individual user level, stitching together clicks and touchpoints for a single customer journey. MMM works at the aggregate level, looking at total weekly sales against total weekly spend across a market or region.
- That aggregate approach is precisely why MMM keeps working when attribution struggles. Because it never needs to identify or track an individual user, it is largely unaffected by cookie deprecation and the broader loss of tracking signal that has hollowed out multi-touch attribution, a resilience noted in Harvard Business Review’s refresher on marketing mix modeling.
For marketing professionals building a measurement stack in 2026, that distinction matters more than ever. Attribution tells you what happened inside a tracked journey. MMM tells you what happened to the business, including the channels and offline effects that attribution never sees.
How does MMM work? Adstock, saturation and decomposition explained
Underneath the dashboard, MMM runs on a handful of statistical concepts that turn raw spend data into a decision-ready output. None of them are exotic once you see the logic.
Adstock and decay. Advertising rarely produces its full effect the moment it airs. A television advert built brand memory that lingers for weeks, while a paid search click converts almost immediately or not at all. Adstock modelling captures this carry-over by applying a decay rate to each channel, so a pound spent on TV last month still contributes some lift this month, while a pound spent on search this week has mostly finished its job by Friday. Open-source implementations of this logic, such as the one documented on this GitHub marketing mix model repository, show how differently each channel’s decay curve behaves once you plot it.
Saturation and diminishing returns. Every channel has a point where extra spend stops paying off at the same rate. Response curves, often modelled with a Hill function, capture this: cheap early impressions convert well, but as you flood a channel, each additional pound buys a smaller slice of incremental sales. This is the mathematical backbone of knowing when to stop scaling a channel and start diverting budget elsewhere.
Base versus incremental decomposition. Once the model accounts for decay and saturation, it separates your sales into two buckets: the base level you’d see with zero marketing (driven by brand equity, repeat purchase, distribution), and the incremental lift attributable to specific activities. This decomposition is the single most useful output for a finance conversation, because it answers the question every CFO eventually asks: what would happen if we simply stopped advertising?
The typical build follows a consistent sequence:
- Transform raw spend and sales data through adstock and saturation functions for each channel.
- Run the regression to estimate each variable’s contribution, alongside pricing, promotions, and external factors.
- Decompose total sales into base and incremental components, channel by channel.
- Validate the output against known business events and, ideally, real-world experiments.
Pro Tip: Don’t skip step four. A model that fits the historical data beautifully but disagrees with what your team already knows happened during a known stock-out or a competitor price war is a model with a specification problem, not a business with unusual data.
Bayesian or frequentist? Choosing your modelling approach
There is no single correct way to build an MMM, and the choice between statistical approaches shapes everything from how long a project takes to how confident you can be in the results.
Frequentist models, typically ordinary least squares (OLS) regression, are the traditional workhorse. They are fast to run, well understood by most analysts, and produce a single point estimate for each channel’s contribution. The drawback is that OLS gives you one number with no built-in sense of how uncertain that number is, and it can struggle when channels are highly correlated with each other, a common problem when two campaigns launch in the same week.
Bayesian MMM takes a different route. Instead of one estimate, it produces a full probability distribution for each parameter, so you get a credible range (say, a return on ad spend somewhere between 1.8 and 2.4) rather than a false sense of precision. It can also incorporate prior knowledge, useful when you have limited history or want to anchor a new channel’s estimate to industry benchmarks rather than let noisy early data run wild, a benefit detailed in this arXiv paper on Bayesian MMM approaches.
Hierarchical or nested models solve a different problem: what happens when one brand or market simply doesn’t have enough weekly data points to model alone? Rather than building 12 separate models for 12 regions, a hierarchical structure pools data across markets while still allowing each one its own estimate, borrowing statistical strength from the group.
Trade-offs worth weighing before you commit:
- Frequentist OLS suits teams that need a fast, transparent answer and have a single, data-rich market to model.
- Bayesian approaches suit teams that need honest uncertainty ranges for board-level decisions, or that operate with thinner data histories.
- Hierarchical models suit multi-brand or multi-market businesses where individual markets are too small to model in isolation.
- All three carry overfitting risk if you segment too finely without enough data points behind each segment.
The right answer usually depends less on statistical purity and more on how the business intends to use the output, and how comfortable stakeholders are reading a confidence interval instead of a single number.
What outputs and KPIs actually matter?
A finished MMM produces more than a chart. It produces a set of figures that should directly change what you do with next quarter’s budget.
Decomposition contribution percentages show what share of total sales each channel, plus base demand, actually accounts for.
ROAS and marginal incremental ROAS (miROAS) are not the same thing, and confusing them is one of the most expensive mistakes a marketing team can make. Standard ROAS tells you the average return across all spend on a channel. miROAS tells you the return on the next pound you’d spend, which is nearly always lower than the average once a channel starts saturating. Budget decisions should be built on miROAS, not average ROAS, because average ROAS can look healthy right up until the moment you overspend into a saturated channel.
Response curves translate saturation into a practical operating range, showing you the spend level at which each channel’s returns start to flatten. This is the chart that tells you whether a channel has room to scale or is already near its ceiling.
A model’s statistical fit metrics, such as R-squared and MAPE (mean absolute percentage error), tell you how well the model explains historical variation, but a high R-squared alone does not make a model trustworthy. The best-practice standard is to pair those statistical checks with genuine business validation, comparing model outputs against known campaign events and in-market experiments, as Ipsos MMA’s MMM guidance recommends.
Practical questions to ask of any model output before acting on it:
- Does the decomposition match what the team already knows about seasonal peaks and known promotional weeks?
- Does miROAS, not headline ROAS, support the reallocation being proposed?
- Has the model been checked against an in-market test, not just its own historical fit?
What data do you need before starting an MMM project?
Data quality decides more of an MMM’s success or failure than the choice of statistical technique. Get this wrong, and even a well-specified Bayesian model will produce confident, wrong answers.
The starting point is cadence and history. Most robust models are built on weekly data covering two to five years, giving the regression enough seasonal cycles and enough variation in spend to separate one channel’s effect from another’s, a standard reflected in the Wikipedia entry on marketing mix modeling. Shorter histories, or data with long gaps, directly reduce the model’s ability to isolate cause from coincidence.
Beyond the calendar, a working data set typically needs:
- A sales or revenue KPI at the same weekly cadence as everything else, cleaned of any known reporting anomalies.
- Spend by channel, ideally split by campaign type rather than lumped into one paid media line.
- Pricing and promotional calendars, since a discount week will otherwise get mistaken for a media effect.
- Distribution or availability data, particularly for retail brands where a stock-out can masquerade as demand collapse.
- External indicators such as competitor activity, macroeconomic shifts, or category seasonality.
Missing data is the norm, not the exception, and how you treat it matters, especially for a retail brand where how to start a shoe brand measurement can be particularly complex. Walled-garden platforms rarely hand over granular daily spend in a clean format, and offline channels like print or out-of-home often arrive as a single lump invoice rather than a weekly series. The Think with Google handbook on marketing mix modelling is blunt about this: accurate media capture and rigorous validation are non-negotiable, because a model built on sloppy inputs will produce confident, wrong answers.
Pro Tip: Before you trust any model output, reconcile your internal spend totals against platform-reported summaries from each ad platform. Discrepancies here are often the single biggest time sink in a project, and they are far easier to catch before the model runs than after you’ve already reallocated budget on the strength of a flawed number.
One more governance habit worth building in from day one: sanity-check every new data delivery against the prior period’s summary before it enters the model, rather than discovering a broken feed three weeks into a build.
How do you use MMM for budget scenario planning?
The real value of an MMM shows up once you start asking it “what if” questions rather than just reading the historical decomposition.
A well-built model lets you simulate moving £50,000 from one channel to another and see the projected sales impact before you spend a penny of it. This works because the saturation curves calculated during the build already tell you where each channel sits on its response curve, so the model can estimate the marginal return of adding or removing spend at that specific point, not just the historical average.
In practice, this scenario layer supports decisions like:
- Scaling a channel that’s still on the steep part of its response curve, where extra spend is clearly still paying off.
- Holding spend flat on a channel that has flattened out, where more money would simply be wasted on diminishing returns.
- Cutting a channel entirely when its miROAS falls below the return available elsewhere in the mix.
- Shifting the timing of spend, pulling budget forward into a known seasonal peak rather than spreading it evenly across the year.
The reallocation logic itself is usually ROAS-weighted at the margin: money moves from channels where the next pound buys the least incremental return towards channels where it buys the most, subject to real-world constraints like minimum spend commitments, creative production capacity, or a brand’s tolerance for pulling entirely out of a channel.
When presenting this to stakeholders, resist the temptation to show a single confident number. If the model was built with a Bayesian approach, show the range, not just the midpoint, and be explicit that a projected 12% sales lift from reallocation might realistically sit anywhere between 8% and 16%. Boards trust ranges more than they trust false precision, once they’ve been burned by a single number that didn’t land.
How does MMM fit with attribution and experiments?
MMM was never meant to work alone. Its real power shows up when it sits alongside attribution and controlled experiments in a shared measurement stack, each covering the other’s blind spot.
Attribution excels at tactical, in-channel optimisation: which creative variant is winning inside a single platform, which audience segment converts best this week. MMM excels at strategic, cross-channel questions: which of your ten channels is actually driving incremental revenue once you account for everything else happening at the same time. Use attribution to fine-tune inside a channel, and use MMM to decide how much budget that channel deserves in the first place.
The two can also calibrate each other. Running a geo-holdout test, deliberately pausing a channel in a subset of regions while running as normal elsewhere, gives you a clean, causal read on that channel’s true incrementality. Feeding that result back into the MMM sharpens its response curves and builds confidence that the model’s estimates reflect reality rather than statistical coincidence. Combining MMM with this kind of experimental calibration produces stronger causal claims than either method alone, a point Ipsos MMA’s MMM resource makes explicitly.
A workable governance rhythm typically includes:
- A model refresh cadence, often quarterly, so the estimates stay current as spend patterns and market conditions shift.
- At least one in-market or geo-holdout test per year to validate the model’s biggest assumptions.
- A shared dashboard that gives media buyers, finance, and leadership the same numbers, rather than three separate spreadsheets telling three different stories.
- A named owner who is accountable for keeping the data feeds clean between refreshes.
Because MMM runs on aggregate data rather than individual tracking, it remains reliable as third-party cookies disappear and platform-level tracking keeps degrading, which is exactly why more marketing teams are treating it as the anchor of their measurement stack rather than a periodic side project.
What does an MMM project actually look like, phase by phase?
Commissioning an MMM, whether built in-house or through an external partner, tends to follow a consistent shape regardless of who runs it.
- Scoping. Define the business question, the channels and markets in scope, and which KPI the model needs to explain. This phase also sets expectations on what the model can and cannot answer.
- Data collection and quality assurance. Gather weekly history across sales, spend, pricing, promotions, and external variables, then reconcile it against platform summaries before anything gets modelled.
- Model build. Apply adstock, saturation, and the chosen statistical approach (frequentist, Bayesian, or hierarchical) to produce the decomposition and response curves.
- Validation. Check the output against known business events and, where possible, an in-market experiment, refining the model where discrepancies appear.
- Scenario testing. Build the what-if simulations that turn the model into a genuine planning tool rather than a static report.
- Handover. Deliver the outputs, the dashboard, and a refresh plan to the team who will actually use them week to week.
For a single-brand, single-market build, this typically runs eight to twelve weeks from kick-off to handover. Enterprise engagements spanning multiple brands or markets, especially where hierarchical modelling is needed, usually run longer.
Internally, you’ll need someone who owns the data feeds, a stakeholder from finance who can sign off on the base versus incremental split, and a marketing lead who will actually act on the reallocation recommendations. When evaluating an external vendor or software platform, press on four things specifically: how they validate their models against real-world tests, how transparent they are about the assumptions inside the model, whether you get direct access to the underlying dashboard and raw outputs or only a slide deck, and how the refresh cadence is priced once the initial build is done.
Where does Evolve Commerce fit into this measurement picture?
Full-funnel measurement is only as good as the systems feeding it, which is where Evolve Commerce’s approach differs from a single-channel media buyer. Evolve Commerce runs paid media, creative production, and lifecycle email and SMS as one interconnected system, with performance data flowing into the AdWize analytics platform rather than sitting in disconnected platform dashboards.
That matters directly for MMM, because a model is only as reliable as the spend and outcome data behind it. Server-side attribution and AI-powered performance insights inside AdWize give a cleaner, more complete data feed than stitching together exports from half a dozen ad platforms by hand.
Evolve Commerce’s client work, including growth for brands such as Hunter Boots, Juicy Couture, and FILA, has produced annual revenue growth rates between 130% and 450%, detailed further in Evolve Commerce’s case studies. If you’re evaluating any measurement partner, not just Evolve Commerce, press them on the same points:
- Ask for evidence that model outputs have been validated against real in-market tests, not just historical fit.
- Ask for direct access to raw outputs and dashboards, not a static slide deck delivered once a quarter.
- Ask how often the model gets refreshed, and what happens to the recommendations in the gap between refreshes.
Where marketing mix modelling fits in your measurement roadmap
Not every business needs an MMM on day one. It earns its place once you’re spending enough across enough channels that a single-source view (a Meta dashboard, a Google Ads report) starts actively misleading you about what’s actually driving revenue. If you’re running meaningfully diversified paid media alongside offline or brand activity, that point arrives sooner than most marketing teams expect.
The order of investment matters more than people admit. Get the data foundation right first, clean weekly feeds, reconciled spend, a real promotional calendar, before you commission any model, because a sophisticated technique built on messy inputs is worse than no model at all. MMM comes next, followed by targeted experiments to calibrate its biggest assumptions, and only then does attribution refinement earn its place, fine-tuning the tactical layer once the strategic picture is trustworthy.
The biggest blocker isn’t usually statistics. It’s organisational: getting finance, media buyers, and leadership to agree on one shared number before the reallocation conversation starts.
— Evolve Commerce
Ready to put marketing mix modelling to work?
An alternative to piecing measurement together channel by channel is to use a team running paid media, creative, and lifecycle marketing feeding results into a single analytics system designed to show revenue drivers.

One such system is a proprietary analytics platform combining server-side attribution with AI-powered performance insights to avoid reconciling multiple ad platform dashboards before budget conversations. An initial engagement process often includes a discovery call and review of existing data and spend history, followed by a sample analysis indicating opportunities for channel mix improvement before formal proposals.
If you’re weighing up whether your current measurement setup is actually telling you the truth about channel performance, get in touch through Evolve Commerce’s website to arrange a discovery conversation about your marketing data.
Sources
For readers who want to go deeper into the statistical and practical detail covered here, these sources informed the analysis throughout this article: