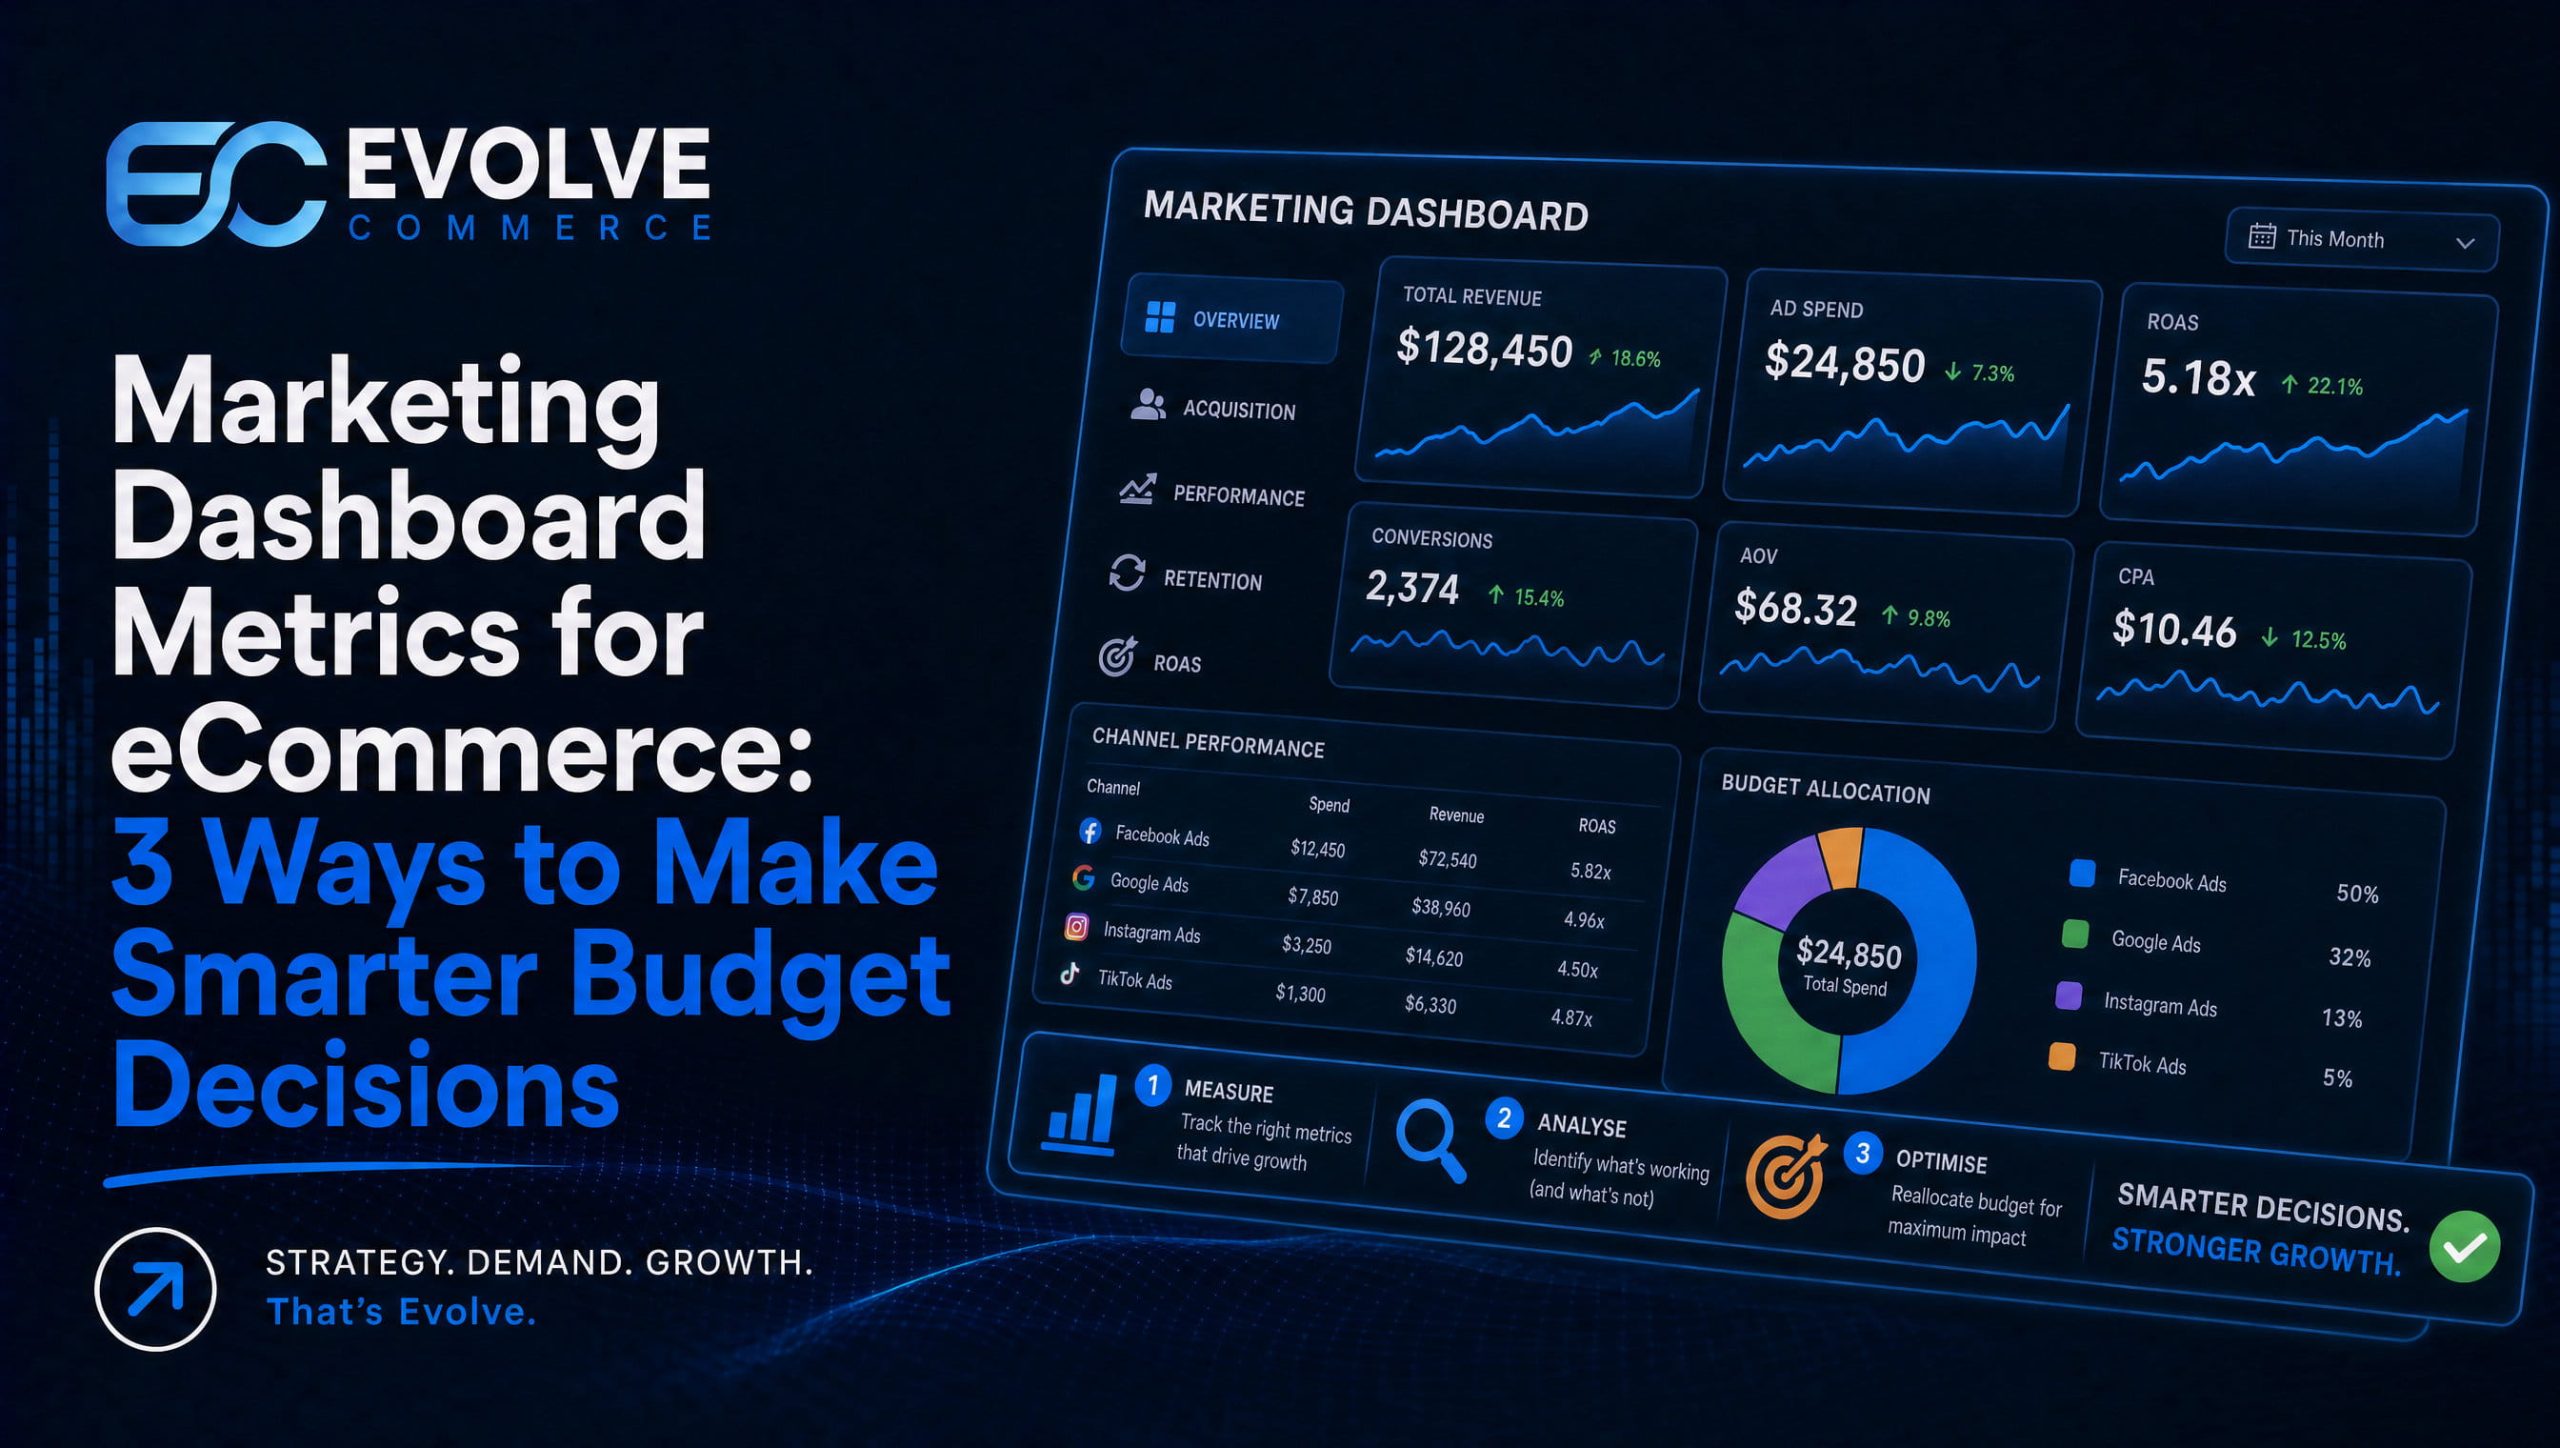
Build your marketing dashboard metrics around a focused set of decision-making KPIs, including marketing-sourced revenue, blended CAC, CAC payback period and ROMI. These form the executive core of an effective marketing dashboard because each should inform a budget allocation, staffing decision or campaign strategy. If a metric doesn’t help drive a decision, it belongs further down the dashboard, not at the top.
- Put marketing sourced revenue, ROMI, blended CAC, and CAC payback on executive views; keep conversion rates, clicks, and impressions in channel drilldowns.
- Use real time wallboards for teams adjusting spend that day, and monthly snapshots for stakeholders who need context without daily fluctuations.
- Assign every KPI an owner, review cadence, warning threshold, and shared source of truth to prevent finance and marketing from reporting conflicting revenue figures.
- Use mix modelling for budget planning, incrementality tests before scaling channels, and multi touch attribution for daily bid and budget changes within campaigns.
- One study found integrated measurement improved budget efficiency about 9% and was expected to lift sales at least 40% more than last touch attribution.
Table of Contents
- Core marketing KPIs every dashboard should consider
- Types of marketing dashboards and when to use each
- How to choose metrics and build a KPI framework that maps to business decisions
- Measurement approaches: MMM, incrementality testing and MTA
- Dashboard design best practice and common pitfalls to avoid
- Practical dashboard examples and template ideas
- Evolve Commerce perspective: how we connect metrics, creative testing and revenue
- How we can help you put this into practice
- FAQ
- Sources
Core marketing KPIs every dashboard should consider
A dashboard earns its place on someone’s screen when its numbers answer a question a decision-maker is actually asking. Outcome KPIs sit at the top because they connect marketing activity to the business: marketing-sourced revenue shows how much of total revenue marketing can reasonably claim, ROMI and ROI translate spend into return, blended CAC shows the true cost of acquisition across all channels combined, CAC payback period tells you how many months it takes to recover that cost, and CLTV shows whether the customers you are acquiring are worth keeping.
Tactical KPIs matter too, but they belong one layer down. Conversion rate, CPA or CPL, CTR, CPC, impressions, reach and frequency are diagnostic: they explain why an outcome KPI moved, rather than telling you whether the business is healthy. Surfacing all of them on a hero view is exactly how dashboards turn into what measurement specialists call a museum of charts, numbers on display with nothing attached to a decision.
Engagement and organic metrics round out the picture without needing to compete for top billing:
- Email open rate and click-through rate signal list health and message relevance.
- Social engagement and video completion rate show creative resonance before it shows up in revenue.
- Organic sessions and keyword ranking movements track visibility gains that often precede conversion gains by weeks.
The practical rule we use: outcome KPIs go on the hero card, tactical and engagement metrics live in drilldowns that a channel owner opens when an outcome number needs explaining. That separation keeps the main view clean enough for a chief marketing officer to read quickly, while still giving analysts the detail they need when something needs investigating.
Types of marketing dashboards and when to use each
Different audiences need different dashboards, and trying to serve all of them with a single view is a common reason dashboards stop getting opened. Matching the dashboard type to its reader keeps each one sharp.
- Executive or CMO dashboard: a focused set of outcome metrics, reviewed weekly or monthly, built to support decisions about budget allocation and investment level.
- Channel dashboards: separate views for paid media, SEO, email and social, each carrying channel-specific KPIs alongside creative or content diagnostics relevant to that channel.
- Campaign and experiment dashboards: short-lived views built around a single test, tracking lift, statistical significance and incremental revenue rather than ongoing performance.
- Operational wallboards: real-time feeds for teams that need to react within the day, such as paid media pacing against budget.
- Summary snapshots: periodic, slower-moving views for stakeholders who need context rather than live numbers.
Real-time feeds suit anyone actively managing spend that hour, such as a paid media manager watching daily budget pacing. Summary snapshots suit a finance director who wants a monthly read without the noise of daily fluctuation. Running both at once, rather than one or the other depending on the audience, is usually what causes alert fatigue and dashboards that get muted.
How to choose metrics and build a KPI framework that maps to business decisions
Choosing metrics well starts with the business, not with the data that happens to be available. Begin from the company’s actual objectives, cascade those into marketing goals, then pick north-star KPIs with supporting metrics beneath them, keeping the whole set focused. CMOs who translate marketing outcomes into language a finance team already uses, such as market share and profitability, tend to find it easier to secure ongoing support for marketing budgets.
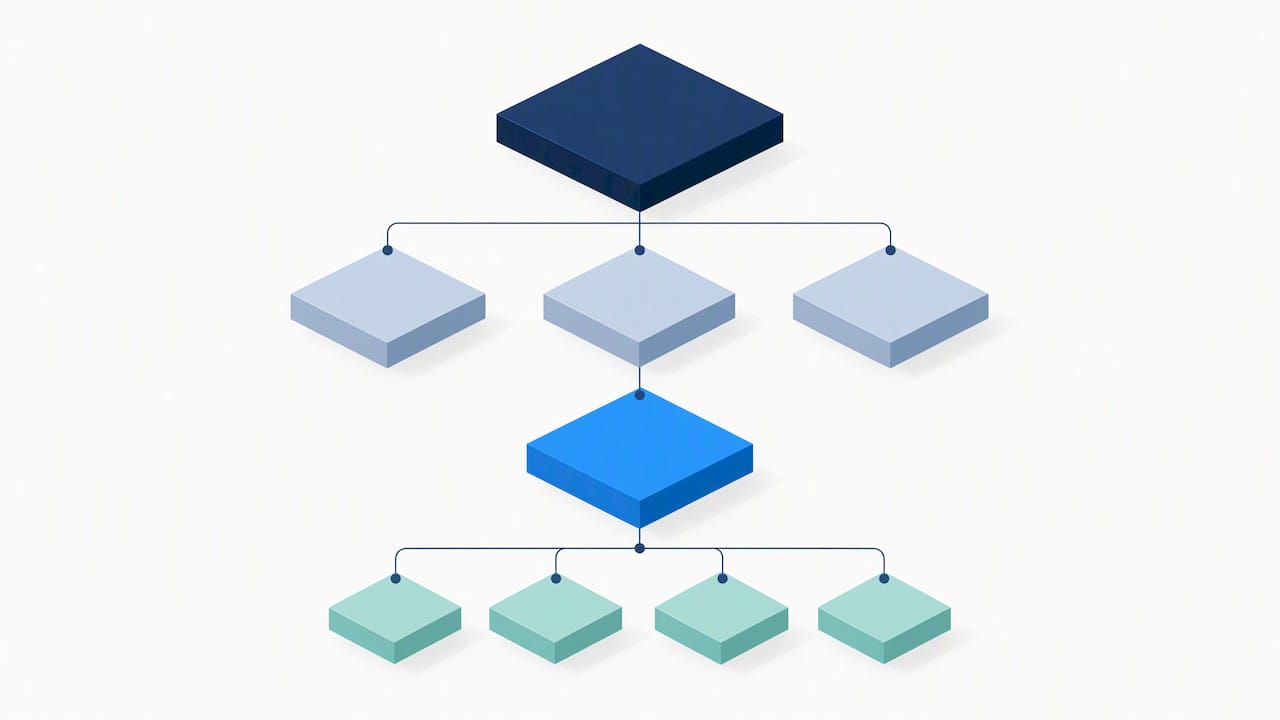
Every KPI on the dashboard should have an answer to one question: what decision does this number trigger? A blended CAC that creeps upward might trigger a channel mix review. A falling email click-through rate might trigger a creative refresh. If nobody can name the decision, the metric is tactical detail, not a KPI, and it should move to a supporting view. Strategic KPIs for full-funnel marketing planning should sit above tactical ones for exactly this reason.
Assign an owner to every metric, along with a review cadence, a threshold that counts as a warning sign, and one single source of truth. Without that last part, finance and marketing end up quoting different revenue figures in the same meeting, which erodes trust in the dashboard faster than any design flaw.
A workable build sequence looks like this:
- Align on business objectives with finance and leadership.
- Define the north-star KPI and its three to ten supporting metrics.
- Agree definitions and data sources for each metric before building anything.
- Build the dashboard around decisions, not around available data fields.
- Set review cadences and owners for every metric on the page.
Pro tip: Write the decision each KPI should trigger directly on the dashboard build document before a single chart gets designed.
Measurement approaches: MMM, incrementality testing and MTA
No single measurement method tells the whole story, which is why teams increasingly blend three approaches rather than picking one. Marketing mix modelling works at a strategic level, using aggregated spend and outcome data to guide budget planning. Incrementality testing, usually run as holdout or geo experiments, validates whether a channel is actually causing incremental sales rather than capturing demand that would have converted anyway. Multi-touch attribution operates at the operational level, helping teams make daily and weekly optimisation calls within a channel.
- Run MMM on a recurring cycle for strategic allocation decisions.
- Use incrementality tests to validate a channel’s true contribution before scaling spend on it.
- Lean on MTA for day-to-day bid and budget adjustments within a live campaign.
Combining the three into what measurement specialists call a unified approach, or a measurement trifecta, reduces the contradictory conclusions that come from trusting a single model. A unified measurement whitepaper found that integrating MMM, incrementality testing and MTA can improve budget allocation efficiency by approximately 9% and is expected to drive sales uplifts at least 40% higher than relying solely on last-touch attribution. Separate BCG research found that teams who refresh MMM frequently, calibrate it against experiment results and share one KPI currency across departments are more likely to embed measurement directly into decision-making. On a dashboard, that means showing model outputs with a visible confidence range rather than a single definitive figure, so a reader understands how firm the number actually is. Teams exploring this without relying on cookies can start from a practical marketing mix modelling approach rather than building one from scratch.
Dashboard design best practice and common pitfalls to avoid
Good dashboard design starts with the decision, not the chart library. Put the metric that matters most where the eye lands first, show trend context alongside the current value rather than a bare number, and match the visualisation to the data: a line for trend, a bar for comparison, a single bold figure for a hero KPI.
- Keep hero metrics to a handful; anything beyond that stops being a dashboard and becomes a museum of charts nobody reads.
- Give every chart a clear owner, a review schedule and an escalation path for when a number crosses a threshold.
- Retire dashboards nobody opens rather than letting them accumulate as dead weight in a reporting tool.
- Avoid vanity metrics such as raw impressions or follower counts unless they are tied to a named decision.
Pro tip: Attach a standing dashboard review to an existing weekly meeting and automate threshold alerts, rather than hoping someone remembers to check.
Practical dashboard examples and template ideas
A few starting templates save most teams from building from a blank canvas:
- Executive snapshot: north-star KPI, revenue trend, ROMI, blended CAC, flagged anomalies.
- Paid media channel view: spend, CPA or ROAS, top-performing creative variants, incremental lift where tested, drawing on a structured creative testing framework.
- SEO or organic view: sessions, ranking movement, attributed conversions, assisted conversion share.
- Experiment view: tested variations, lift, confidence interval, recommended next action.
Evolve Commerce perspective: how we connect metrics, creative testing and revenue
We build dashboards around the same principle this guide sets out: a handful of decision-ready metrics beats a wall of charts. Our approach pairs integrated analytics with creative testing that ties directly to revenue outcomes, so a winning ad variant shows up on the same view as the CAC and ROMI it influenced. Clients we have worked with have reported annual revenue growth between 130% and 450%, and our AdWize platform is built to keep that kind of outcome visible rather than buried across disconnected reports. In practice, the path tends to run through an audit, a KPI framework, a dashboard build, then ongoing optimisation.
— Evolve Commerce
How we can help you put this into practice
We built AdWize to handle the dashboard design, attribution and measurement blending this guide describes, without asking your team to stitch tools together manually. For teams who want support sooner rather than later, the next steps are straightforward:
- Request a 360° marketing audit to see where your current reporting has gaps.
- Review AdWize plans, starting at £49 per month on the Starter plan, £149 per month on Accelerator or £249 per month on Scale.

For a deeper dive into blending measurement models without relying on cookies, our guide to marketing mix modelling walks through the planning side in more detail.
FAQ
What are metrics in a dashboard?
Metrics on a dashboard are the measured values, such as revenue, cost per acquisition or conversion rate, that summarise marketing performance in one place. On a well-built dashboard, each metric is tied to a specific decision rather than shown purely for visibility.
What is the 3 3 3 rule in marketing?
This is not a recognised measurement standard, and definitions of it vary widely depending on the source. Rather than relying on an informal rule, we recommend building a focused KPI set anchored to business objectives.
What should a marketing dashboard include?
A strong dashboard includes north-star outcome KPIs, such as marketing-sourced revenue or ROMI, alongside supporting metrics that explain movement in those outcomes. Everything else belongs in a drilldown view rather than the main screen.
What are some good marketing metrics?
Marketing-sourced revenue, blended CAC, CAC payback period and ROMI work well as executive-level metrics because each ties directly to a budget decision. Conversion rate, CPA, CTR and email click-through rate work well as supporting metrics that explain why those outcomes moved.
Sources
A dashboard is only as trustworthy as the systems feeding it. The usual sources are web analytics, server-side tracking, ad platform exports, CRM and ecommerce order data, email platform metrics, and outputs from MMM or MTA models. Getting these to agree depends on canonical identifiers, consistent customer and order IDs mapped the same way across every system feeding the dashboard.
A simple ETL discipline keeps this manageable:
UK consent rules add a real constraint here. Guidance from government communications services confirms that analytics and advertising cookies require active opt-in consent under PECR and UK GDPR, with no pre-ticked boxes and no reliance on legitimate interests for marketing cookies. That shrinks the client-side data available for attribution, which is why first-party data collection and server-side tracking, such as the approach outlined for cross-channel attribution without individual tracking, matter more each year.
A dashboard built for this reality labels modelled figures clearly, marking them as estimated rather than directly observed, so a reader knows when they are looking at a measured number and when they are looking at an inference.